
| Article Details | |||||||||||||||||||||||||||||||||||||||||||||||||||||||||||||||||||||||||||||||||||||||||||||||||||||||||||||||||||||||||||||||||||||||||||||||||||||||||||||||||||||||||||||||||||||||||||||||||||||
|
|||||||||||||||||||||||||||||||||||||||||||||||||||||||||||||||||||||||||||||||||||||||||||||||||||||||||||||||||||||||||||||||||||||||||||||||||||||||||||||||||||||||||||||||||||||||||||||||||||||
| Title | HUMAN DEVELOPMENT : Why There is a Shift From Economic Development to Human Development and How That Shift is Measured ? | ||||||||||||||||||||||||||||||||||||||||||||||||||||||||||||||||||||||||||||||||||||||||||||||||||||||||||||||||||||||||||||||||||||||||||||||||||||||||||||||||||||||||||||||||||||||||||||||||||||
| Article by | Akhilesh Patel | ||||||||||||||||||||||||||||||||||||||||||||||||||||||||||||||||||||||||||||||||||||||||||||||||||||||||||||||||||||||||||||||||||||||||||||||||||||||||||||||||||||||||||||||||||||||||||||||||||||
| Category | Faculties of Law | ||||||||||||||||||||||||||||||||||||||||||||||||||||||||||||||||||||||||||||||||||||||||||||||||||||||||||||||||||||||||||||||||||||||||||||||||||||||||||||||||||||||||||||||||||||||||||||||||||||
| Content |
1. INTRODUCTION
Development refers to economic, social, political and cultural processes of change in human societies which seeks to satisfy the spiritual and material needs of man. Historically this development process was state centric with given primacy on physical accumulation of income or materials. Individuals in process of such kind of development were marginalized by powerful and rich community having supports and backup of western governments and institution promoting capitalist oriented development theories. Trickle down approach furthered by structural adjustment programmes of World Bank and IMF lead to the detrimental of human life. John F. Kennedy and his successors following the principles of ‘a rising tide lifts all boats’ led to sunk several smaller boats under high rise of tide. There have been four theories regarding the nexus between economic growth and social development- The first theory holds the view that social development is a product of economic growth. This theory is well known as trickledown theory that makes emphasis on economic programs and assumes that economic growth would tend to produce social development. Okun and Richardson defined economic growth as "a sustained, secular improvement in material well-being as reflected in an increasing flow of goods and services." Thus it encourages throwing resources for economic growth and privatization. The second theory says that economic growth and social development are two unrelated events - Zuvekas as champion of this approach says that economic growth can occur without social welfare development and therefore countries should limit the distribution of the domestic benefits of growth to privileged elite at the expense of widespread social welfare development. He states that without specifically targeting the poorer sections of the population for assistance in meeting basic needs, economic growth could produce an ever widening gap between the wealthy and the poor.The third theory describes that neither social development nor economic growth is a primary cause of the other, but they are inter dependent –As a proponent of this view , Srinivasan is of the opinion that the policies for economic growth and the policies towards basic needs development are interwoven. He suggests that too much emphasis on basic needs would, at least in the short run, hurt economic growth which, in turn, would damage future improvement in the basic needs fulfillment. The fourth theory holds the view that social development precedes economic growth - Streeten as proponent of this approach has expressed that extra income would not always be spent on items basic to the individual's welfare. He notes that some basic needs may be satisfied more effectively through public services including access to clean drinking water, schools and health services, and therefore, are not directly linked to individual income. In fact, Streeten suggests a ‘trickle-up’ effects when he states "basic needs is not primarily a welfare concept; improved education and health can make a major contribution to increased productivity[1]." The idea of human development can be traced from MacNamara in 1971 when he asserted that in process of development the work, the distribution of income, and the qualities of life are equally important measures of development. His idea was furthered and materialised by thought and writings of Amartya Sen and Mahbub-ul-Haq, the founder of Human Development Report. Although the precise definition of human development is not possible because of its increasing scope day by day, however a formal definition of human development is set out in the first Human Development Report, according to which – “Human development is a process of enlarging people's choices. The most critical ones are to lead a long and healthy life, to be educated and to enjoy a decent standard of living. Additional choices include political freedom, guaranteed human rights and self-respect i.e. the ability to mix with others without being 'ashamed to appear in public.” The report further says –“Human development has two sides: the formation of human capabilities such as improved health, knowledge and skills; and the use people make of their acquired capabilities - for leisure, productive purposes or being active in cultural, social and political affairs. If the scales of human development do not finely balance the two sides, considerable frustration will result.[2]” Thus human development is a broader holistic concept encompassing economic development i.e. developing capabilities for material choices as well as spiritual development i.e. developing capabilities in body and mind for enlarging people’s choices and enabling them to be a productive member of society. In fact Human development recognizes that wealth is not the good we are seeking, for it is merely useful and for the sake of something else broadly elaborated under Human development index and several thematic publications of human development reports as well as ‘millennium development Goals ‘ which are further discussed under separate heads in this article.
2. WHY THERE HAS BEEN A SHIFT FROM ECONOMIC DEVELOPMENT TO HUMAN DEVELOPMENT?
The Human Development approach arose as a result of growing criticism to the leading development approach of the 1980s, which presumed an automatic close link between national economic growth and human development. There have been several causes for a shift from economic development to human development; few of them may be discussed under following heads: 2.1. Domination of Trickle-down Approach of Development The trickle-down approach was widely adopted in the 1960s as the key measure for reducing poverty. Proponents of trickle down approach of development argue that richer individuals and companies are the driving force behind the economic growth. The wealth created by more successful parts of the economy and more success people will naturally trickle down and benefit everyone. Therefore the country should focus on ensuring right environment for rich and larger companies to thrive. State should give emphasis on low taxation and lack of regulation. Proponents of this theory also believe that when government helps companies, they will produce more and thereby hire more people and raise salaries. The people, in turn, will have more money to spend in the economy and would get a better life. USA as a champion of this trickle down approach made other states to blindly follow this approach.The past 50 years in USA have seen a gradual decrease in the top bracket's income tax rate, from 91% in 1963 to 35% in 2003[3] however the failure of trickle down in USA itself is well explained by Mehrun Etebari in his article " TRICKLE- DOWN ECONOMICS: Four Reasons Why it Just Doesn’t Work” wherein on the basis of government reports he finds – 2.1.1. Cutting the top tax rate does not lead to economic growth. Growth increased drastically after the 1982 tax cut, reaching as high as 7.3% in 1984; however, as the Reagan-Bush, Clinton administrations went on and taxes for the rich were slashed even further, growth fell to negative levels during 1991. Overall the there is no nexus between GDP and tax reductions at top level business companies. 2.1.2. Cutting the top tax rate does not lead to income growth. Small peaks in median income growth after top-bracket tax cuts in the mid-1960s and early 1980s is seen , but datas shows income decreases after the tax cuts of the late 1980s and strong growth after the tax increase of 1993. In fact here is no logical co-relation is found between tax deduction and income growth rate. 2.1.3. Cutting the top tax rate does not lead to wage growth. Further the growth in average hourly wages did increase during the 1980s following the first Reagan tax cuts, albeit two years after the cuts took effect. But, just like GDP growth and median income growth, hourly wages decreased following the late 1980s tax cuts, and spiked upwards after the 1993 tax increase. 2.1.4. Cutting the top tax rate does not lead to job creation While the top tax rate trends downward over the period, the annual change in unemployment doesn't seem to trend at all. There has been constant bailout packages while companies are constantly busy in retrenching their employees. Similalry, in Brazil 50 percent of the national income goes to the top 10 percent of the population, while the bottom 10 percent receive less than 1 percent; In South Africa during the apartheid regime, where the rich mainly white owned the bulk of the country’s wealth and never much trickled down to the poor mainly black. Thus we see that trickle-down is nothing more than an excuse for the rich to do nothing. 2.2 Illogical Adherence of Structural Adjustment Programmes (SAPs) With the growing threat of debt defaults in the early 1980s because of financial crisis under OPEC’s sudden rise of oil prices coupled with US Strict norms of loans to prevent inflation, Structural Adjustment Programmes (SAPs) were devised by IMF and World Bank in exchange for rescheduling debts and further aid to countries in particularly the developing and underdeveloped countries. This involved privatization of state enterprises, public spending cuts and price liberalization. SAPs have been devised with 4 fundamental objectives namely- (1) Liberalisation i.e. promoting the free movement of capital and opening of national markets to international competition. (2) Privatisation of public services and companies. (3) De-regulations of labour relations and cutting social safety nets. (4) Improving competitiveness [4] Based on these objectives, SAPs prescribed following conditions for new loans - 1. Reduction of government deficit through cuts in public spending i.e. cost recovery programmes or subsidies to several economy; 2. Higher interest rates on government sanctioned loans. 3. Liberalization of foreign exchange rules and trade deregulation; 4. Privatisation of public companies; 5. Deregulation of the economy, for example: liberalization of foreign investment regulations; deregulation of the labour market, e.g. wage ‘flexibility’; abolishing price controls and food subsidies 6. Shift from import substitution to export production. The outcomes of SAPs were not proved to be beneficial. Elimination of subsidies and prize controls, covered with devaluation lead to price increases and reduce real earnings in the formal and informal sectors. Similarly deregulation of the banking system coupled with liberal market policy lead to very high interest rates which made most goods unaffordable to the majority. Cost-recovery programmes in the health sector increased the inequality in health care delivery, reduced health coverage and increased the number of people without access to health care. Diseases like cholera, malaria and yellow fever again found in increasing ratio. As a result of labor rules relaxations several people were retrenched and became jobless, foodless and homeless. Privatization of social services like health and education makes these services unaffordable for the poor who were forced to choose between feeding their children or paying for their school uniforms, stationery and school fees. Further it also led to the severe income gap between elites and middle as well as lower class people because the cost burden were ultimately shifted at the bottom level and upper classes continuously enjoyed several kinds of tax exemptions. Sigrun I. Skogly in this context observes that the negative consequences of the lack of participation and lack of accountability under SAPs led to severe violation of Bill of Rights as seen under several riots and political uprisings which occurred as reactions to the IMF's and World Bank's policies[5]. In theory SAPs promoted a development which has no ethical and human face. Human beings were marginalized in process of development. 2.3 Extending Economic Gaps in Society 2.3.1. Income Disparity in India: The shortsighted illogical western oriented economic policies created huge gap in society. The economic gaps disparity in India can be seen below -
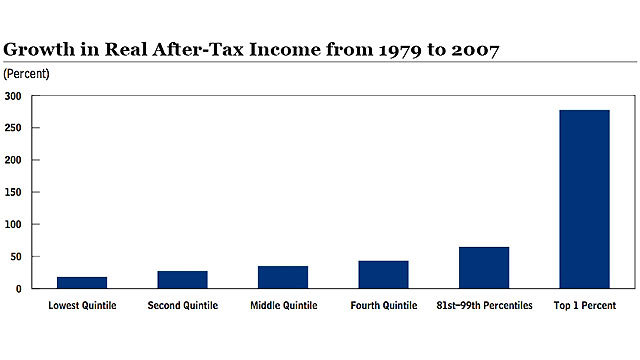
2.3.2. Income Disparity in USA During the ongoing October 2011 ‘Occupy Wall Street Movement’, the Congressional Budget Office (CBO) of USA study released, the income status of Americans and found that the richest 1 percent in the U.S. soared 275 percent income growth from 1979 to 2007, but the bottom 20 percent grew by just 18 percent.
The study compared real after-tax household income between 1979 and 2007 and found that while the income of therichest 1 percent nearly tripled, increases were smaller down the economic ladder. After the 1 percent, income for the next highest 20 percent grew by 65 percent, much faster than it did for the remaining 80 percent of the population which is still lagging well behind the top percentile[7]. All these reflect that equitable sharing is not obtained by the people in national economic growth. So to calculate human development in terms of national income is manifestly a wrong strategy generally pursued by elite capitalist biased governments while destroying the social fabric. 2.4. Flaws in Development measures Prior to HDI, the development was state centric and individuals were object not subject of this state centric development. Theory of dependency was prevalent and individual development was measured in term of national development determined under GDP and GNP[8]. In order to access the individual progress the GDP per capita was devised which is obtained by dividing the GDP by the total population of the country. Here the important fact to be noted is that once the GDP is divided by population, the every individual get a notional (deemed) income which may rise with the rise of the income of richer community and state economy, without giving any actual change in a individual’s own earning. Thus an individual gets the promise of a fake income which is actually not his own. 2.5. Critical Observations of first Human Development Report 1990 The Human Development Report is an independent publication commissioned by the United Nations Development Programme (UNDP) which analyzed in its first report that despite economic achievements of several states, the living standard of their masses remained largely unchanged because of their hesitation to invest resources in social sectors while some states made appreciable job in raising living standard of their masses despite of their poor performance at economic level. The following chart drawn from first HDR 1990 reflects the scenario-
This report shows that Sri Lanka, Chile, Costa Rica, Jamaica, Tanzania and Thailand, among others, do far better in human development than in income, showing that they have directed more of their economic resources towards human progress. On the other hand Brazil, Oman, Saudi Arabia, Algeria, Mauritania, Senegal, Cameroon and the United Arab Emirates, among others, do considerably worse, showing that they have not yet translated their income into human progress. The report further observes that though the developing countries have made significant progress towards human development in the last three decades, there are still more than a billion people in absolute poverty, nearly 900 million adults unable to read and write, 1.75 billion without safe drinking water, around 100 million completely homeless, some 800 million who go hungry everyday, 150 million children under five i.e. one in three, who are malnourished and 14 million children who die each year before their fifth birthday. Further also according to the report the averages of progress in human development conceal large disparities within developing countries- between urban and rural areas, between men and women, between rich and poor. Rural areas in the developing countries have on the average half the access to health services and safe drinking water that urban areas have, and only a quarter of the access to sanitation services. Literacy rates for women are still only two-thirds of those for men and the maternal mortality rate in the South is 12 times that in the North. Levels of health, education and nutrition among higher income groups far exceed those of the poor in many countries. In fact the critical observation of HDR 1990 was the major driving force for altering state preferences to throw its resources not only in economic sectors but also in social sectors. All these reflect that there is no automatic relationship between rate of growth of GNP and improvement in life expectancy or literacy. People, therefore, started looking beyond figures of growth rate in GDP as a result many other approaches such as Basic Needs Approach and Human Development Approach witnessed the dawn of a new era with more emphasis on human development. Economists have enlarged their sphere of work by including even those areas which, earlier were covered within the domain of sociology, ecology, education and health etc[9]. The quality of life is thus regarded as an important indicator of development.
3. HOW HUMAN DEVELOPMENT IS MEASURED?
In order to assess the state performances on human development, since 1990 Human Report has published a human development index (HDI) which is a composite indicator comprising for each country three components: the average length of life of the country's population, their 'knowledge,' and their access to a range of choices sufficient for a decent standard of living. For HDI, the first component is measured as life expectancy at birth for the population as a whole; the second component is a measure of educational achievement based on a country's adult literacy rate and the percentage of its school aged population enrolled in the educational system as a proxy for 'knowledge'; and the third is an adjusted measure of per capita income and purchasing power parity (PPP). Per capita income is incorporated as a proxy indicator of the extent to which people in the country can make consumption choices in relation to their needs and wishes. 3.1 Goalposts for calculating the HDI While constructing indices the first step is to fix minimum and maximum values of each indicator which is fixed by the UNO each year e.g. in 2007-08 this minimum and maximum value was as such –
These are standardized values and commonly applied to all countries. The construction of Human Development Index requires the computation of individual indices of all the indicators. The formula for the construction of individual indices of the indicators is stated as under: Thus if India's life expectancy at birth is 62.6 years, its life expectancy index would be: = 62.6 - 20.0 / 80.0-20.0 = 42.6 / 60.0 = 0.73. In order to calculate Human Development Index we are required to construct three indices: (1) Life expectancy index; (2) Educational attainment index; (3) Real GDP per capita index. 3.2. Calculation of Life expectancy index The life expectancy index measures the relative achievement of a country in life expectancy at birth. The value of this index varies between 0-1. E.g .Turkey, with a life expectancy of 71.4 years in 2005, the life expectancy index is 0.773 812 as calculated under above mentioned formula which is reproduced below- Life expectancy index = Actual Value (Life Expectancy) - Minimum Value / Maximum Value - Minimum Value i.e. 71.4 – 25 / 85-25 = 71.4. 3.3. Calculation of Educational attainment index The education index measures a country's relative achievement in both adult literacy and combined primary, secondary and tertiary gross enrolment. First, an index for adult literacy and one for combined gross enrolment are calculated. Then these two indices are combined to create the education index, with two-thirds weight given to adult literacy and one-third weight to combined gross enrolment. For Turkey, with an adult literacy rate of 87.4% in 2005 and a combined gross enrolment ratio of 68.7% in 2005, the education index is 0.812 as calculated under above mentioned formula which is reproduced below- Adult literacy index = Actual Value (adult literacy rate) - Minimum Value / Maximum Value - Minimum Value i.e. 87.4 – 0 / 100-0 = 0.874. Gross enrolment index = Actual Value (gross enrolment ratio) - Minimum Value / Maximum Value - Minimum Value 68.7-0/100-0 = 0.687 Thus the Education index = 2/3 (adult literacy index) +1/3 (gross enrolment index) = 2/3 (0.874) + 1/3 (0.687) = 0.812 Educational attainment of the people is one of the measures of the quality of life of the people. 3.4. Calculating the GDP index: The GDP index is calculated using adjusted GDP per capita (PPP US$). In the HDI income serves as a surrogate for all the dimensions of human development not reflected in a long and healthy life and in knowledge. Income is adjusted because achieving a respectable level of human development does not require unlimited income. Accordingly, the logarithm of income is used. For Turkey, with a GDP per capita of8,407 (PPP US$) in 2005, the GDP index is 0.740 as calculated under below mentioned formula - GDP index = log (GDP per capita)-log (Minimum Value) /log (Maximum Value)-log (Minimum Value) i.e. log (8,407) - log (100)/ log (40,000) - log (100) = 0.740 3.4 Calculation of HDI Once the three key indexes have been calculated, determining the HDI is straightforward. It is a simple average of the three dimension indices i.e. HDI = 1/3 (life expectancy index) + 1/3 (education index) + 1/3 (GDP index). Thus for Turkey the HDI = 1/3 (0.773) + 1/3 (0.812) + 1/3 (0.740) = 0.775 HDI is criticized for arbitrary calculations; not devising indexes of measurement for ecological balance, good governance, human rights conditions; and for adopting more state centric measurement than on comparative performance index etc. However like all indices HDI also has weaknesses and limitations but the fact that inclusion of so many indices might undermine the calculation of data and its systematic observations can’t be denied. The primary advantages of the HDI is that its components -length of life, access to knowledge and access to sufficient income for a reasonable standard of living relate to some of the most basic elements for human life which offers a driving force for realization of other several enumerated components of the Human Development which have been discussed by Human Development Reports in its several thematic reviews and reports such as sustainable development, human security, poverty eradication, democracy, equality etc. Thus though the concept of human development is much broader than any single composite index can measure, the HDI offers a powerful alternative to income as a summary measure of human well-being and has a profound impact on development thinking around the world.
4. MILLENNIUM DEVELOPMENT GOALS
The MDGs are 8 goals adopted by world leaders in 2000 following the UN Millennium Summit that provide a framework for the entire international community to work together towards a common end – making sure that development has a human face and reaches everyone, everywhere. The framework provides a systematic way for countries to develop their own action plan based on existing processes to pursue their MDG priorities.
If we closely examine MDGs it mainly focuses on three major areas of human development: bolstering human capital, improving infrastructure, and increasing social, economic and political rights, with the majority of the focus going towards increasing basic standards of living. The objectives chosen within the human capital focus include improving nutrition, healthcare (including reducing levels of Child mortality, HIV/AIDS, tuberculosis, malaria and increasing reproductive health) and education. For the infrastructure focus, the objectives include improving infrastructure through increasing access to safe drinking water, energy and modern information & communication technology; amplifying farm outputs through sustainable practices; improving transportation infrastructure; and preserving the environment. Lastly, for the social, economic and political rights focus, the objectives include empowering women, reducing violence, increasing political voice, ensuring equal access to public services, and increasing security of property rights. The goals chosen are intended to increase an individual’s human capabilities and advance the means to a productive life. Like HDI, MDGs are also criticized for impartibility of achievement of objectives, collection of data, reliability thereof etc. Jeffrey James for example observes “some of the Millennium Development Goals do not distinguish between potential and actual achievements. In the case of education for instance, the completion of primary education by all students is not an end in itself, but rather an intermediary phase in the process of learning to read and write, and so on [11]. Sakiko Fukuda Parr further criticizes MDGs for overemphasizing on top-down planning and implementation as well as exclusion of many objectives such as employment, reproductive health, human rights, and many other issues that developing countries and civil society groups have been advocating [12]. Despite of these few draw backs, the fact that with strong backup from world development institutions along with states’ commitment, the world is gradually on a human oriented track of development under MDGs can’t be denied.
5. CONCLUSION
Human development is a constant short term as well as long term concept; short term in the sense it enables people to fulfill their basic choices which generally desire for material resources like food, education and earn reasonable income for social security; long term in the sense it requires enlarging peoples material as well as spiritual choices in an atmosphere of democracy, human security, ecological balance; decent living standards with leisure and social security etc. Human development requires state’s equal focus on economic and social issues and warns that over diversion of resources in any one sector will directly affect the another one because of their interlink-age and mutual enforceability . In fact the measures like HDI has promoted a healthy competition for human development amongst several states, and encouraged scholars and people to criticize and pressurize governments domestically as well internationally for adopting developments with human face enlarging their capabilities and choices. Though much has been done yet human beings are not still liberated from hunger and basic needs; at the same time he has become prone to several threats such as earthquakes, internal conflicts, adverse impacts of globalization etc. Thus Human development requires a broader agenda for research and policies to respond to these challenges. In this context Amartya Sen, the basic philosopher of the idea of human development writes on the occasion of the release of HDR 2011: “Twenty years after the appearance of the first Human Development Report, there is much to celebrate in what has been achieved. But we also have to be alive to ways of improving the assessment of old adversities and of recognizing and responding to new threats that endanger human well-being and freedom.”
REFERENCES
Books and Articles Murphy, Craig N.,” THE UNITED NATIONS DEVELOPMENT PROGRAMME : A Better Way ?”, (Cambridge: Cambridge University Press, 2006) Wesiss, Thomas George & Sam Daws (eds.), ” THE OXFORD HANDBOOK ON THE UNITED NATIONS”, (Oxford: Oxford University Press, 2007) Chattopadhyay, Srikumar; H.S. Sharma,”SUSTAINABLE DEVELOPMENT: Issues and Case Study”, (New Delhi: Concept Publishing Company , 1998.) Toussaint, E. and Comanne, D. “GLOBALIZATION AND DEBT. “ Notebooks for Study and Research 24/25, 1995. Articles: o Bhatnagar, Ravi Kant,” AN ANALYSIS OF THE EVOLUTION OF THE HUMAN DEVELOPMENT INDEX WITH SPECIAL REFERENCE TO ITS INCOME COMPONENT”, The Bangladesh Development Studies, Vol. 27, No. 3 (September 2001), pp. 35-65 o Skogly, Sigrun I.,” STRUCTURAL ADJUSTMENT AND DEVELOPMENT: HUMAN RIGHTS--AN AGENDA FOR CHANGE”, Human Rights Quarterly, Vol. 15, No. 4 (Nov., 1993), pp. 751-778 o Herbert Jauch , “STRUCTURAL ADJUSTMENT PROGRAMMES: Their origin and international experiences, Labour Resource and Research Institute (LaRRI), Namibia March 1999 o JAMES, JEFFREY, “MISGUIDED INVESTMENETS IN MEETING MILLENNIUM DEVELOPMENT GOALS: A Reconsideration Using Ends-Based Targets,” Third World Quarterly, Vol. 27, No. 3 (2006), pp. 443-458 o Fukuda-Parr, Sakiko,” MILLENNIUM DEVELOPMENT GOALS: Why They Matter”, Global Governance”, Vol. 10, No. 4 (Oct.–Dec. 2004), pp. 395-402 o Krishna Mazumdar,” AN ANALYSIS OF CAUSAL FLOW BETWEEN SOCIAL DEVELOPMENT AND ECONOMIC GROWTH: The Social Development Index,” American Journal of Economics and Sociology, Vol. 55, No. 3 (Jul., 1996), pp. 361-383
Human Development Reports Ø CONCEPT AND MEASUREMENT OF HUMAN DEVELOPMENT, Human Development Report 1990 (Oxford : Oxford University Press, 1990) Ø NEW DIMENSIONS OF HUMAN SECURITY, Human Development Report 1994 (Oxford : Oxford University Press, 1994) Ø ECONOMIC GROWTH AND HUMAN DEVELOPMENT, Human Development Report 1996 (Oxford : Oxford University Press, 1996) Ø HUMAN DEVELOPMENT TO ERADICATE POVERTY, Human Development Report 1997 (Oxford : Oxford University Press, 1997) Ø HUMAN RIGHTS AND HUMAN DEVELOPMENT, Human Development Report 2000 (Oxford : Oxford University Press, 2000) Ø MILLENNIUM DEVELOPMENT GOALS: A Compact Among Nations to End Human Poverty, Human Development Report 2002 (Oxford : Oxford University Press, 2002) Ø THE REAL WEALTH OF NATIONS: Pathways to Human Development, Human Development Report 2010 (Oxford : Oxford University Press, 2010) Websites http://hdr.undp.org/en/statistics/ http://www.un.org/millenniumgoal http://www.unesco.org/water/wwap/facts_figures/mdgs.shtml http://abcnews.go.com/Business/income-doubles-top-percent-1979/story?id=14817561 [1] Krishna Mazumdar,” An Analysis of Causal Flow between Social Development and Economic Growth: The SocialDevelopment Index,” American Journal of Economics and Sociology, Vol. 55, No. 3 (Jul., 1996), at p. 362 [2] Richard Jolly, “Human Development,” in Thomas Weiss & Sam Daws (eds.),”The Oxford. Handbook on the United Nations”, Oxford University Press, 2007 at p.636. [3] Mehrun Etebari,” TRICKLE- DOWN ECONOMICS: Four Reasons Why it Just Doesn’t Work”, online available at http://www.faireconomy.org/research/TrickleDown.html . [4] Toussaint, E. and Comanne, D. “Globalization and Debt. “ Notebooks for Study and Research 24/25, 1995 at p. 14. [5] Sigrun I. Skogly,” Structural Adjustment and Development: Human Rights--An Agenda for Change”, Human Rights Quarterly, Vol. 15, No. 4 (Nov., 1993), at p. 764 [6] Source of Information is based on survey done by open magazine. [7] See online available at http://abcnews.go.com/Business/income-doubles-top-percent-1979/story?id=14817561. See also at http://news.yahoo.com/budget-negotiations-happens-bottom-u-wealth-pyramid-collapses-172715069.html [8] GDP is defined as the total value of all the goods and services produced within a country in a given period of time which is usually taken a calendar year i.e. GDP = consumption + investment + government spending + (exports - imports). GNP on the other hand is the gross national product which is a figure obtained by adding all the income generated by nationals of the country made within or outside the country to the GDP. Thus the major difference between GDP and GNP is that while GDP takes into account income generated within the country, GNP takes into account income generated by the nationals, whether they are within the country or residing outside the country. Normally GDP is expressed in terms of its growth over previous year. For example if the GDP this year is up by 5% in comparison to last year, it can be said that the economy has grown by 5%. [9] Ravi Kant Bhatnagar,” An Analysis of the Evolution of the Human Development Index with Special Reference to ItsIncome Component ”, The Bangladesh Development Studies, Vol. 27, No. 3 (September 2001), at p. 35. [11] JEFFREY JAMES, “Misguided Investmenets in Meeting Millennium Development Goals: a reconsideration using ends-based targets,” Third World Quarterly, Vol. 27, No. 3 (2006), at p. 443 [12] Sakiko Fukuda-Parr,” Millennium Development Goals: Why They Matter”, Global Governance, Vol. 10, No. 4 (Oct.–Dec. 2004), at p. 400
|
||||||||||||||||||||||||||||||||||||||||||||||||||||||||||||||||||||||||||||||||||||||||||||||||||||||||||||||||||||||||||||||||||||||||||||||||||||||||||||||||||||||||||||||||||||||||||||||||||||
| You have to be logged in to view the contact details of the author. | |||||||||||||||||||||||||||||||||||||||||||||||||||||||||||||||||||||||||||||||||||||||||||||||||||||||||||||||||||||||||||||||||||||||||||||||||||||||||||||||||||||||||||||||||||||||||||||||||||||
|
|||||||||||||||||||||||||||||||||||||||||||||||||||||||||||||||||||||||||||||||||||||||||||||||||||||||||||||||||||||||||||||||||||||||||||||||||||||||||||||||||||||||||||||||||||||||||||||||||||||


|
|||||
| Causelist Websites | A.P High Court Daily Causelist | Central Administrative Tribunal | A.P State Administrative Tribunal | Supreme Court of India | Causelists for all Courts | | ||||
|
Terms and conditions - Disclaimer - Website Map | Copyright © 2009 - 10 www.goforthelaw.com. All rights reserved |